


Oil analysis can help you get the most out of your lubricant and equipment. Oil analysis is a very useful tool, and knowing how to read your oil analysis report is critical to your maintenance program's success.
An oil analysis report includes a wealth of information on your equipment, lubricant, and procedures. Each item found can assist you in determining which pollutants have invaded your system and underlying issues are creeping up. Understanding how the oil tests work helps you to get the most out of your Oil Analysis Program.
An oil analysis report is a critical component of a successful operation. Knowing how to examine the oil analysis report and looking beyond the report summaries can assist in minimizing equipment malfunction and needless teardowns.
Elemental Analysis
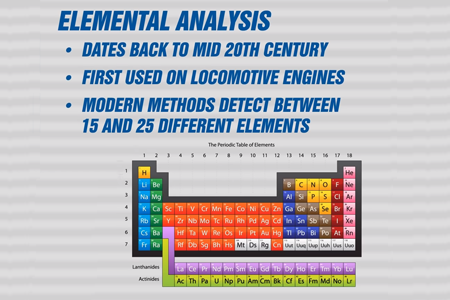
Elements analysis is perhaps the most basic test in the oil analysis toolkit. Elemental analysis works by stimulating atoms using a high-energy source in AES, such as iron atoms from wear debris, zinc atoms from a ZDDP additive molecule, or silicon from silica (dust) contamination. The atoms absorb energy from the excitation source and undergo a high-energy electronic state transformation. Atoms do not like staying in these excited states and quickly lose the energy they have obtained, primarily through releasing light energy, according to quantum physics principles. The energy of light emitted, which is inversely proportional to wavelength, is determined by the atom's electronic structure and hence differs for each kind of atom. Wavelength is then related to concentration to measure the amount of elements detected.
What to Do When Your Analysis Goes South

Be Familiarized with the Units of Measure
What exactly is a ppm? The values on an oil analysis report can range from a few parts per million (ppm) or several hundred ppm for wear metals and pollutants to several thousand ppm for some additive components, depending on component type, oil type, application, and so on. A ppm is simply the number of parts of the element in question per million parts of the sample, as the name indicates. To put it another way, a measurement of 1 ppm of an element is 1 g of the element per g of sample, which is the same as 1 mg per Kg, or around one ounce per 6500 gallons of oil! The quantity of light at a given wavelength for the components in issue may be obtained by evaluating the calibration standards, which can then be linked to the known concentration in the standard solution. By detecting the quantity of light emitted at a given wavelength and using the calibration curve to translate this light intensity into a concentration or ppm, an unknown concentration of the same element in a test sample may be calculated.
Monitor the Data Trends

When reviewing elemental analysis data, it's crucial to focus on the trend line, or the change in elemental concentrations over time, rather than the absolute value of each element. This is critical since wear rates for various machines may vary based on component types, manufacturer and model, oil type, age, and usage, among other factors. This sort of rate-of-change study can be quite useful in detecting early symptoms of wear and contamination.
Anatomy of an Atomic Emission Spectrometer
Commercial analysis laboratories typically employ one of two types of atomic emission spectrometers: an inductively coupled plasma (ICP) or a rotating disc electrode (RDE) device. The primary distinction between the two is how the sample is vaporized and how the atoms are stimulated by the high-energy source. The oil is fed into a high-temperature argon plasma in an ICP apparatus, where the atoms are vaporized, excited, and then produce light. The oil is vaporized and stimulated in an RDE spectrometer, commonly known as an "Arc-Spark" device, by a high voltage discharge between an electrode and a revolving carbon disc.
The remainder of the instrument is essentially the same, whether it's an ICP or RDE spectrometer. The light that the excited atoms emit is collected and focussed onto the spectrometer's slits. A diffraction grating, analogous to a prism, divides light of different wavelengths or colors into discrete wavelengths based on their angle of diffraction in the spectrometer. A light-sensitive photodiode is used to detect the light intensity at each angle, which is referred to as a channel, and the resulting voltage signal is translated to a concentration in ppm using a simple calibration method.
There is virtually little difference in data accuracy between the two types of equipment if they are both calibrated properly. There is, however, one significant distinction between ICP and RDE devices. Size limitations affect both the ICP and RDE devices. The size of particles that can be measured with traditional AES is limited as a result of this phenomenon. Only particles smaller than around 3 microns may be measured with ICP. The limit for RDE instruments is significantly greater, at about 8 to 10 microns.
Remember to Read the Labels
Make sure your reports are exact and correct when you open them. It is possible to make mistakes, but it is also possible to prevent them. Look for the lubricant's manufacturer and kind, the oil's viscosity grade, the date the unit was serviced, and if the oil was changed or new oil was added. Now that you know who owns the analysis reports, it's time to find out what's going on in your unit.
Always remember to compare the data to previous findings, since a poor diagnosis indicates that something has changed from previous trends. Don't simply focus on the problematic figures; attempt to see the larger picture. If an issue has happened, it has most certainly been documented elsewhere in the report. It might just be an analytical mistake if no other trend upsets are visible.
Contact the lab if you feel this is the issue or if you need clarification on other test findings. Most laboratories would gladly listen to any concerns and, if necessary, perform tests or propose further confirmatory studies that consumers may not be aware of. The second stage entails determining the problem's urgency. If the abnormal findings have just surpassed the alert threshold, a simple examination may be all that is necessary; as a result, the test must be repeated at half the typical analysis period. A problem has probably arisen if the crucial limitations have been breached.
Cross-Examination of the Report
After you've figured out what's wrong, you'll need to examine the machine more closely. Visit the machine with a group of operators, lube technicians, and mechanics; standing next to it could spark some memories that might otherwise be forgotten in a control room or workshop. Inquire about any changes in operating habits from the operators, and inquire about how the sample was collected from the lube tech. That may be the solution right there if the regular lube tech didn't take the sample.
Find out whether there were any unrecorded oil changes or top-ups. Information from workers on different shifts may be required, and there may be a large list of individuals to contact. Ask the mechanics whether any repairs or alterations were made before the previous sample, especially on the exterior of the equipment - an arc welder with a badly positioned or connected ground wire has been known to cause damage.
Inquire about any nearby construction; high vibration or strains caused by poorly designed pipework have also been known to trigger lubricant problems.
Take Action
Now that there is adequate evidence to determine whether or not environmental change occurred. The machine must then be inspected. Take a look at the sight glass and the breather. Take a temperature reading and check for any unusual vibrations. Take a sample for visual inspection; look for sediments, water, soil, or metal contamination. If a visual inspection reveals that anything is wrong, sending a sample to the lab is generally unnecessary. Before doing another lab analysis, take urgent remedial action such as filtration, vibration, or thermography.
If there is a mechanical or environmental issue, the procedures for resolving it should be obvious. A confirming sample may be required, although it is not required if the answer is obvious. If nothing appears to be out of whack, obtain a confirmatory sample and send it to the lab right away. Order the complete set of tests and seek guidance from the lab. You'll need to retest once you've figured out what's causing the issue and fixed it. Continue to retest at regular intervals until the problem is resolved.
CRE Philippines’ Oil Analysis Report Interpretation Online Workshop
Do you already have an oil analysis program in place? Do you still find it difficult to work through your oil analysis report because you believe there are so many things you need to learn? Do not worry! CRE Philippines now offers Oil Analysis Report Interpretation Workshop Live Online on November 24-26, 2021.