![]()
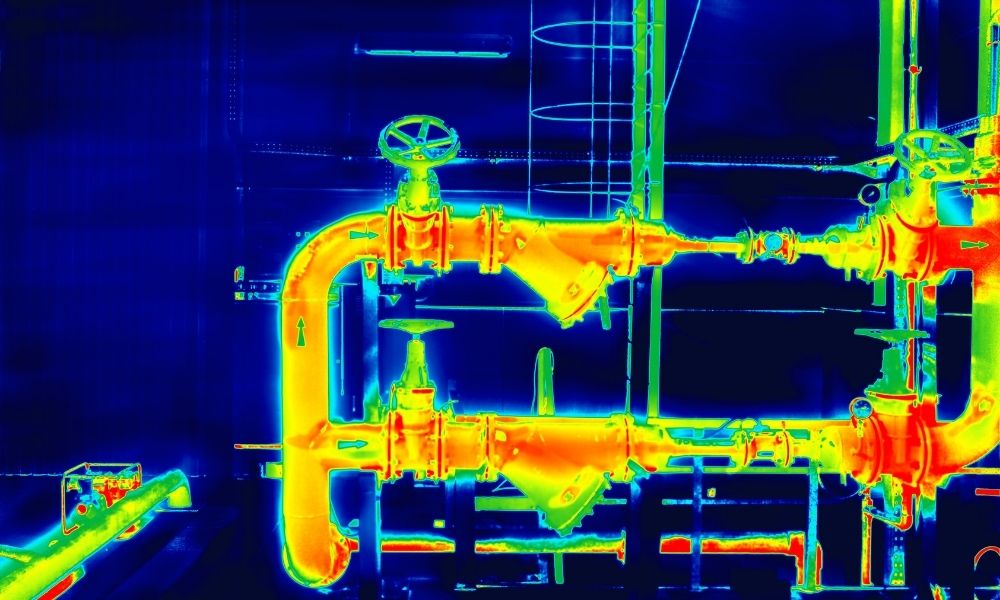
Infrared thermography translates infrared radiation into temperature data and creates images that show temperature distribution. Industries use it in predictive maintenance and condition monitoring to assess machine health and inspect moisture, energy loss, electrical systems, and fluid systems.
Thermograms show measured temperature distributions, revealing heat-producing objects invisible to the naked eye. Regardless of ambient illumination, thermal imagers can easily identify and show infrared wavelengths. Infrared thermography is utilized in plant maintenance and condition monitoring applications such as:
- Motor’s electrical and mechanical characteristics
- Inspections of bearings (abnormal bearing friction)
- Inspection of refractory insulation
- Locating the levels of gas and fluids
Thermography and Infrared Light
Thermal imaging allows us to “see” and measure thermal energy emitted from an object. Thermal energy has a wavelength that is substantially longer than visible light which makes it invisible to human sight, just as radio waves are invisible to us. Because visible light has no effect on the thermal world, you can see clearly in both bright and dark conditions.
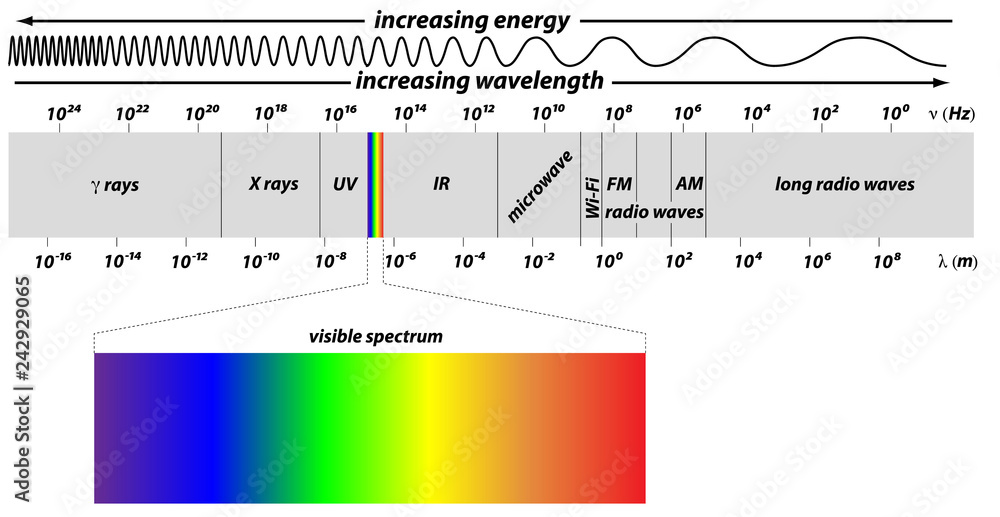
The Spectrum
There are three main zones in the infrared spectrum. Depending on the application, the exact boundaries between these spectral bands may differ slightly. The spectral region employed in infrared thermography is normally between 0.9 and 16 meters, with the most common ranges being 2 to 5 meters and 7 to 15 meters.
Thermography Techniques
The ability to make rough emissivity estimations gives essential information for machine condition monitoring and diagnostics in less-than-ideal situations. Absolute thermography measures a target’s true temperature as accurately as possible when precision is critical. Industry uses several infrared thermography methods, with comparative thermography as the most common approach for providing the best available data.
The Principle and camera
The more thermal energy an object emits, the hotter it is. A biologically or mechanically generated animal, motor, or machine, for example, generates its own heat. During the day, objects like soil, rocks, and plants absorb heat from the sun and release it at night. Because different materials absorb and release thermal energy at different rates, a seemingly uniform temperature is actually a mosaic of varying temperatures.
When infrared radiation is detected by the camera’s sensor, the data is transformed into a colored representation of the scene. Uncooled detectors are less precise but more expensive, while cooled detectors provide superior image quality and precision. A thermal camera with a low spatial resolution (from 60×60 pixels) is sufficient in industrial maintenance, for example. A better spatial resolution is required for more extensive examinations or to see minute details with equally small temperature changes.
- Cooled infrared detectors use cryogenic coolers to lower the detector temperature to cryogenic levels, reducing heat-induced noise below the scene’s signal.
- Uncooled image detectors do not require cryogenic cooling. They use a microbolometer, a type of bolometer that is sensitive to infrared radiation.
Infrared Energy Detection and Limitation
There are three main zones in the infrared spectrum. Depending on the application, the exact boundaries between these spectral bands may differ slightly. The spectral region employed in infrared thermography is normally between 0.9 and 16 meters, with the most common ranges being 2 to 5 meters and 7 to 15 meters.
Infrared radiation is measured according to the light reflected off of the substance or scene being studied in the region of the electromagnetic spectrum from 0.7 m to 4 m. In the semiconductor, glass, and steel sectors, this feature is extremely helpful.
As previously said, infrared thermography has become a commonly utilized technology for preventive maintenance due to its ease of use. However, there are also limitations when using Infrared Inspection. Among them are:
- Infrared equipment is quite costly. You should think about the time and labor needed, as well as the money you’ll save with infrared technology’s early detection warnings.
- When a component is separated by a non-transparent material, such as a glass cover, infrared technology cannot detect temperature. Glass appears non-transparent when seen with an infrared imager.
- To analyze imaging results using infrared data, you’ll need a lot of experience and a lot of information.
How to Uncover Problems
For condition monitoring and preventive maintenance, infrared thermography is an invaluable instrument. It not only allows you to detect thermal irregularities in devices, but it also does so in a non-intrusive, hands-off manner with real-time findings. When performing thermal inspections, thermographers often use one of three methods: comparison, baseline, or thermal trending. The sort of equipment you’re testing and the type of data you want to observe will determine which strategy to utilize.
Comparative Thermography: Inspections of industrial and mechanical components can reveal hidden problems, thanks to the uncovering of hidden problems. Comparative thermography measures the temperature of similar components under similar conditions. Quantitative inspections determine exact temperature values and distributions and are typically performed by highly trained thermographers. Qualitative inspections focus on the differences in temperature rather than actual temperatures.
Baseline thermography captures temperature readings to establish a reference point for an asset. Technicians compare these images with future thermal images to detect potential problems early. They typically take baseline measurements when assets are new or recently repaired.
Thermal–Trending Thermography: Thermography that displays how temperature is distributed in a component or asset over time is known as thermal-trending thermography. It’s an excellent approach to examining mechanical equipment with complex thermal signatures or slow-developing thermal signatures. Monitoring high-temperature refractory insulation in a boiler over time, for example, could aid in determining an appropriate maintenance schedule that reduces downtime.
Infrared Inspection Training

CRE IRT Resource Trainer Jeff Erichsen
Learn how to conduct an Infrared Thermography inspection with our certification program, which meets ISO 18436-7 criteria. The Australian Institute of Non-Destructive Testing has also approved the course (AINDT). Basic Thermal Physics, Basic Heat Transfer Theory, Electromagnetic Radiation, and Infrared Image are all covered in this course. CRE Infrared Inspection training will also teach you how to operate an infrared equipment and conduct thermography examinations.
Ready to safeguard your equipment? Contact us today to schedule training or inquire about our infrared thermography solutions!